
Insight Article
The Architecture of Overload:Why resilience won’t fix workplaces that keep producing pressure
Hero image: Massimo Virgilio via Unsplash.
“The difficult part is not just having too much to do; it is seeing how routinely today’s workaround becomes tomorrow’s workload.”
Work-related stress is widespread, costly, and increasingly difficult to treat as a private problem. In Europe, 45% of workers reported chronic emotional strain in 2023 and 27% reported stress, depression, or anxiety worsened by work in the same year. This pattern, which has intensified in the subsequent years, shows it is not only about individual distress; it also points to a design problem. Risks are actively shaped by high workloads, time pressure, low autonomy, inadequate support, unclear responsibilities, among other factors. Prevention falls short when it focuses on individual coping rather than the root causes embedded in how work is structured.
These numbers are only the doorway; work overload quickly spills out into visible administrative trails. People are exhausted, but fatigue is not the whole story. Many workers describe returning to the same unresolved friction, shifting priorities, and temporary fixes. The difficult part is not just having too much to do, it is seeing how routinely today’s workaround becomes tomorrow’s workload.
Organizations register this strain differently. They track it as absence, turnover, delayed delivery, and operational drag. Through this lens, human experience is translated into an administrative signal; the signal becomes a financial cost; and that cost is used to justify interventions, accelerations, or reorganizations that can displace the pressure.
Seen one by one, these organizational traces of human strain look like separate stories. Read together, they reveal a wider pressure landscape.
What we mean by pressure
In this article, we use pressure to name this underlying organizational condition rather than the psychological side of stress. While stress is a human physiological response to perceived threat, or demand, pressure is the built-in friction, overload, capacity strain, and operational drag architected by the way work is designed. Pressure is not only what a person feels; it is what the work architecture does to people, teams, and organizations.
Once pressure is understood as something produced by work architecture, individual employee support becomes too small. Recovery practices and resilience training do matter; they help people stabilize and self-regulate during periods of strain. But these practices cannot change the structures people return to. If work design continuously produces pressure and overload, resilience can become a coping mechanism that keeps work moving, rather than a real protection from the pressure itself.
Ultimately, scattered public signals of administrative backlogs and operational drag may point to architectures of overload: working environments shaped in ways that continuously produce, move, absorb, and return pressure through everyday structures of responsibility, repair, and handoff.
In this article we explore what public traces reveal about how work is currently designed. Using an LLM-assisted scan via ChatGPT with the GPT-5.5 Thinking model, we mapped publicly available work-pressure signals across sectors from 1 December 2025 to 1 June 2026. To review our reasoning and logic, safeguards, and limitations, see methodological note.
1. From Scattered Traces to Pressure Signals
Public information about work pressure is abundant but scattered. Our first step was to make these public signals comparable. The records used different vocabularies for similar forms of work pressure: a delayed claim, a support queue, a stalled approval, a maintenance backlog, or a recurring incident could all point to structural friction. With that foundation in place, the next step was translation: we mapped these distinct traces into shared pressure signals while preserving the original source language (see methodological note.
Maintenance overload, implementation delay, approval saturation, customer support pressure, and process compliance drag together accounted for about two-thirds of the most visible pressure signals across the mapped records (~67%) (Figure 1, Core). This indicates that public work-pressure traces became most visible where work piled up, delivery slowed, decisions waited, demand pressed against limited capacity, and procedural requirements added drag. The smaller signals are also useful because they show the texture around that pressure, including reporting overhead, visibility gaps, context switching, tooling sprawl, and dependency blockage, among others (Figure 1, Texture).
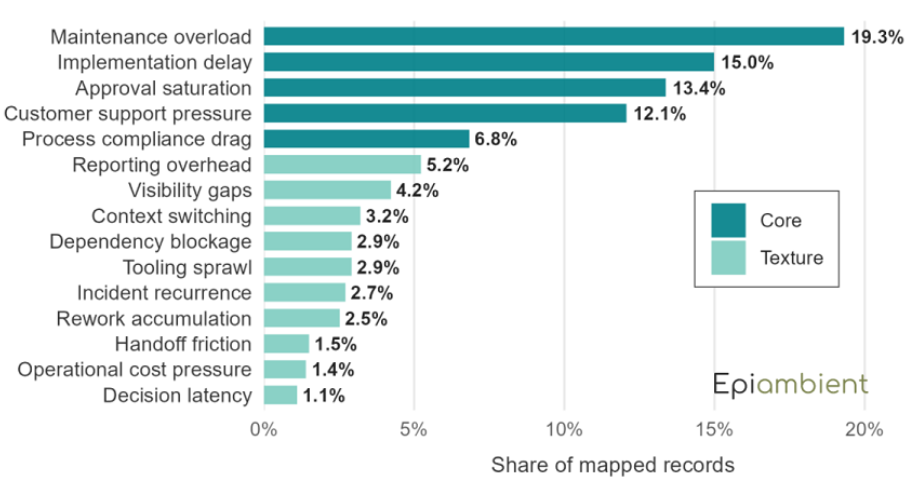
Table 1. Visible pressure areas in public signals captured here.
| Rank | Pressure area | Share of records |
|---|---|---|
| 1 | Governance friction | 26.4% |
| 2 | Maintenance burden | 22.9% |
| 3 | Execution delay | 15.5% |
| 4 | Customer-facing pressure | 12.0% |
| 5 | Information gaps | 8.2% |
| 6 | Capacity strain | 4.6% |
| 7 | Dependency friction | 2.9% |
| 8 | Quality strain | 2.5% |
| 9 | Ownership ambiguity | 1.9% |
| 10 | Coordination strain | 1.3% |
| 11 | Priority conflict | 0.9% |
| 12 | Unmapped signals | 0.6% |
| 13 | Recovery signals | 0.3% |
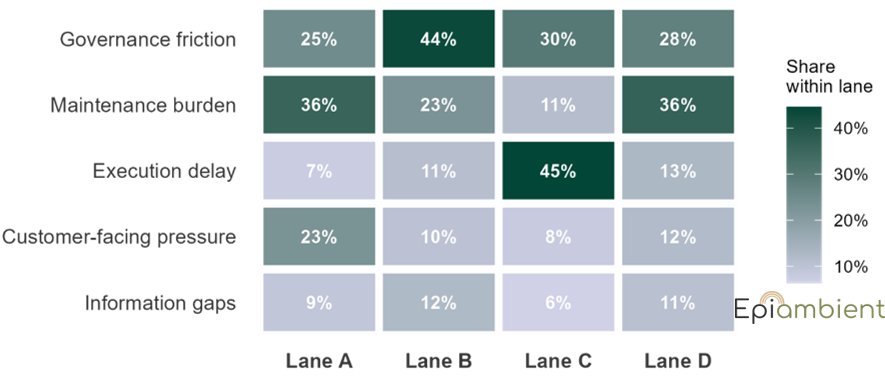
Different observation lanes, or source channels, showed that public pressure does not look identical from every observation point (Figure 2; see methodological note for details). Operational traces close to the work showed more maintenance and frontline burden, while governance and institutional traces made administrative friction, service delay, and capacity constraints more visible. The critical point is that governance friction and maintenance burden remained central, while their expression changed depending on where the evidence was observed.
Taken together, our scan gives scattered public traces a common frame in which the original words remain visible, but repeated patterns become easier to see. What looked like isolated stories can now be read as early signs of a wider work-pressure landscape.
2. The Red Tape Field and the Repair Backlog
To better understand what the two leading pressure areas were made of, we looked inside governance friction and maintenance burden. We wanted to see whether these two areas had the same internal shape or whether they were pointing to different architectures of pressure. They look very different.
Governance friction looked like a red tape field. The dominant signal was approval saturation, which accounted for 50.4% of the governance area (Figure 3, left). The most visible part of governance was the time and effort spent getting work reviewed, justified, approved, or moved through decision layers before the work itself could move forward. In this governance-friction pattern, pressure is created by the administrative terrain around the work: talking about and explaining work, documenting work, and waiting for permission to continue it.
Maintenance burden looked more like a repair backlog (Figure 3, right). The dominant signal was deferred repair work, which accounted for 83.8% of the maintenance area. This points to the physical, digital, and operational conditions people depend on to do their jobs, but which keep waiting because time, budget, ownership, or capacity are already stretched. In this maintenance-burden pattern, the data suggest that pressure builds because the environment keeps functioning through temporary fixes, patched processes, and workarounds that allow the day to continue while the repair burden keeps accumulating.
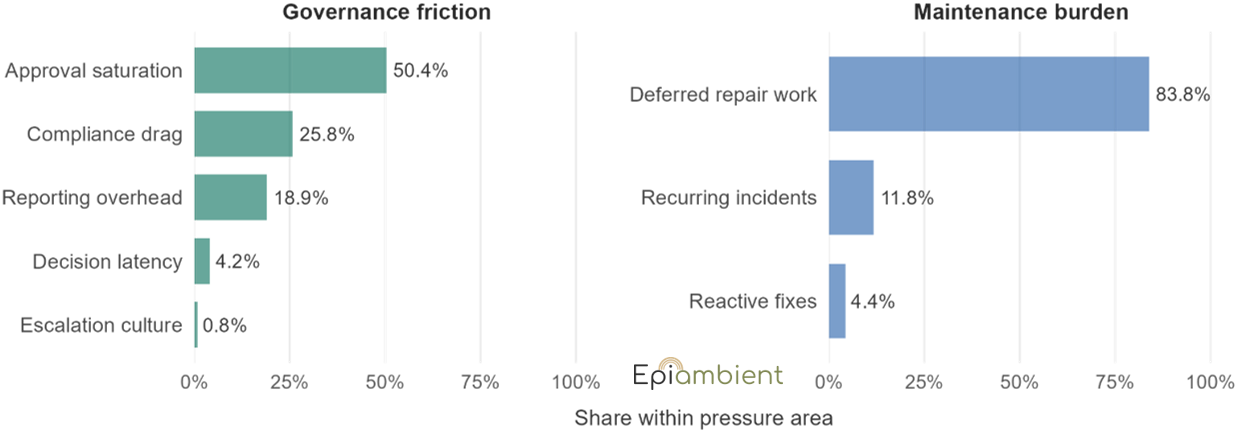
Governance friction and maintenance burden, the two leading pressure areas, are not simply two versions of “too much work.” The former is pressure produced by the machinery around work. The latter is pressure produced by the accumulated burden of keeping the work environment usable. The red tape field slows work down before it moves. The repair backlog makes people keep working around what has already been left unfixed.
3. Same Pressure, Different Operating Environments
The pressure pattern varied across sectors and operating contexts. Governance friction and maintenance burden remained prominent, but their balance changed by sector, suggesting a shared pressure landscape with sector-specific shapes influenced by the kind of work being done (Figure 4).
Healthcare operations showed a distinctive shape, with governance friction accounting for 59% of mapped records within the sector. Governance friction also remained highly visible in public administration, enterprise IT, mixed operations, and AI organizations, ranging from 25% to 34%. This suggests that governance friction becomes especially visible in settings where work passes through formal accountability structures, from clinical review and documentation requirements to public responsibility, institutional review, compliance expectations, and layered decision-making.
Manufacturing showed the sharpest version of maintenance burden, reaching 81% of mapped records within the sector. Similarly, in software and technology, maintenance burden was the strongest visible area, accounting for 47%. In AI organizations, maintenance burden was still prominent at 33%, although it was not the highest pressure area in that sector (Figure 4). In these environments, pressure appeared most visibly through the work of keeping technical, operational, or production systems functioning.
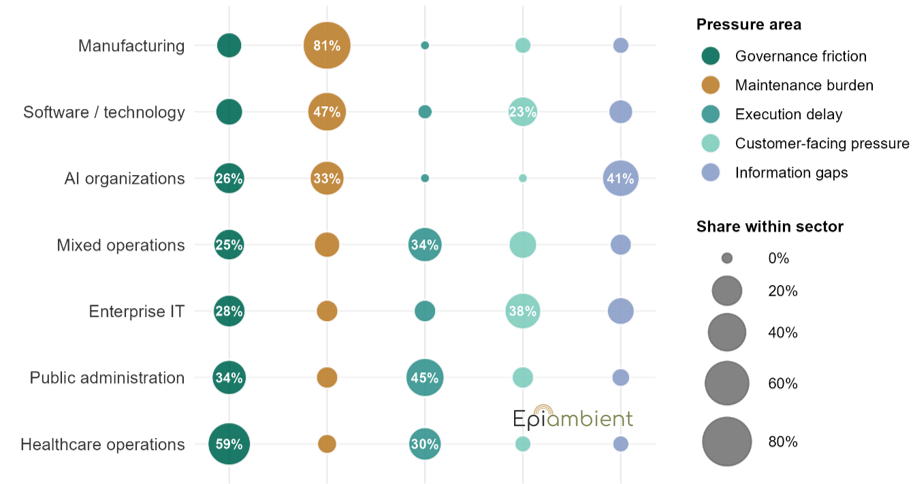
Public administration was the clearest execution-heavy setting, with execution delay at 45%, eleven percentage points higher than governance friction. Mixed operations also showed high execution delay, at 34%. In these settings, pressure became more visible through service delivery, implementation delay, and the difficulty of moving work through institutional or operational systems.
Enterprise IT showed the strongest customer-facing pressure pattern, at 38%, while software and technology also showed moderate levels of this type of pressure, at 23%. This suggests a pressure surface where internal technical operations, service expectations, and user-facing demand may be tightly connected.
In AI organizations, information gaps represented 41% of mapped records within the sector, making AI organizations the only sector where this type of pressure exceeded 20%. This suggests a newer pressure surface: organizations trying to adopt or manage fast-moving technical systems may experience pressure through missing clarity, uneven visibility, and uncertainty about how the work is changing.
Taken together, these patterns suggest that pressure becomes visible through the way work is architected within sectors and their operating contexts. The five largest pressure areas by share of mapped records, namely governance friction, maintenance burden, execution delay, customer-facing pressure, and information gaps, shifted their balance across sectors (Figure 4). This suggests that the local shape of pressure is closely connected to how each operating context organizes control mechanisms, upkeep, implementation and execution, support, and visibility. Our results helped separate the broader pressure pattern from the sector-specific work architectures through which pressure is produced, carried, and likely returned.
4. What Public Evidence Shows First
After mapping where pressure appeared, we asked a different question: what role does a public trace make readable? These roles matter because they move the scan from describing where pressure appears toward understanding how pressure behaves. For this layer, our mapping used six readable roles.
Cost / effort / drag: the operational price of pressure, including slower work, extra coordination, rework, administrative effort, or reduced efficiency.
Load: visible burden placed on people, teams, systems, or processes, such as more work, more waiting, more demand, or more capacity being consumed.
Leakage: pressure spilling beyond its original location, for example into customer support demand, public delay, service degradation, or external complaints.
Reflex: an organizational response to pressure, such as adding a review, approval, report, rule, escalation path, or workaround.
Returned load: pressure that comes back as new or transformed work after an earlier response, such as when a temporary fix creates future maintenance or a reporting requirement creates extra coordination burden.
Causal direction: whether the evidence makes the direction of the mechanism readable, for example whether delay is creating more approvals, approvals are creating delay, or both belong to a larger accumulation pattern.
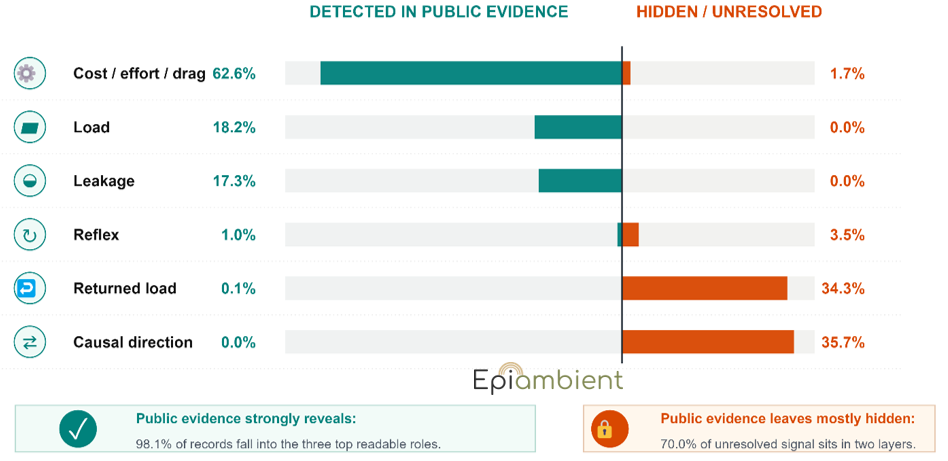
When these roles were compared across the mapped public records, a clear diagnostic imbalance appeared. Public evidence revealed cost / effort / drag (62.6%), load (18.2%), and leakage (17.3%) much more clearly, with these three categories together accounting for 98.1% of all mapped records where a role was detected (Figure 5). At the same time, the hidden or unresolved layer concentrated around causal direction (35.7%) and returned load (34.3%), meaning that 70% of unresolved signal sat within these two deeper layers. This suggests that public evidence is strong at showing the visible price of pressure once it has surfaced: extra effort, operational drag, consumed capacity, spillover, service burden, and other forms of publicly recordable strain. It is much weaker at showing how that pressure was produced, transferred, or returned.
The small detected values for returned load and causal direction should be read as evidence of methodological caution. These roles were coded only when the public trace made them explicit enough to read. In most cases, the public record showed that pressure had surfaced, while the pathway that produced, transferred, or returned that pressure remained inside the organization. Reflex sat between the visible and hidden layers. It was occasionally readable as an organizational response (1.0% detected vs. 3.5% hidden), but public traces more often showed the burden around responses than the response logic itself. This is where organization-specific mapping matters for understanding how pressure behaves inside a particular work architecture. The public scan can identify visible pressure signatures; mapping the organization itself can show how those signatures are produced, carried, and converted into demands on human capacity, economic resources, and operating performance.
5. New Tools, Same Friction: AI and the Pressure Landscape
AI adoption caught our attention because it did not enter the scan only as a technology theme. AI is often presented as an escape from operational drag. We created a stricter subset that retained only records where the controlled classification identified either AI-transition load or automation-push reflexes (see methodological note for details). The strict AI adoption-friction subset suggests a more complicated pattern. It appeared inside the same pressure architecture we had already been tracking.
The revealing shift was not simply that AI appeared in the scan, but where it appeared: inside the same pressure architecture the scan had already been mapping. In the mapped records, AI did not appear as a clean layer of productivity added on top of the organization. It appeared inside the machinery of work itself. The same tools promoted as ways to reduce effort also produced new pressure around oversight, compliance, validation, maintenance, and coordination. In other words, AI adoption did not sit outside the pressure landscape. It became one of the places where the pressure landscape was easiest to see.
Our scan used specific dictionary fields for AI transition load and automation-push responses, alongside broader labels for AI organizations and AI-related public text (see methodological note for details). For this section, we focused on the strict AI adoption-friction subset, defined by explicit dictionary-level evidence of AI transition load or automation-push responses. This subset accounted for 18.2% of the full scan.

Visible pressure area: Governance friction was the largest area in the strict subset, at 28.6%, followed closely by maintenance burden at 24.7% (Figure 6, top left). This connects AI adoption directly back to the two leading pressure areas identified earlier in the scan. AI introduces new tools, but it may also produce a new red tape field: model oversight, vendor compliance, security review, approval workflows, audit demands, and policy tightening around new forms of automated work.
Visible signal: Maintenance overload accounted for 20.9% in this field, followed by process compliance drag at 16.5%, with rework accumulation and approval saturation at 8.8% each (Figure 6, top right). This highlights how AI adoption friction became visible through the ordinary burdens of keeping systems usable, checking outputs, repairing errors, managing compliance, and absorbing new support demand. When producing text, code, decisions, or triage becomes easier, the burden may shift toward verification, integration, oversight, and repair.
Load and organizational response: AI transition load accounted for 42.3% of the load field, far above compliance pressure and support expansion load (Figure 6, bottom left). At the same time, automation push dominated the organizational response layer at 70.3%, with policy tightening far behind at 14.8% (Figure 6, bottom right). This suggests a double movement: organizations push automation to reduce pressure, while also creating new governance and maintenance work around the automation itself.
Our results illustrate how AI redistributes work through the same architecture of overload already visible in the wider scan. In the strict subset, AI adoption appears to recreate both earlier patterns: a new red tape field around oversight, compliance, review, and policy tightening, and a new repair backlog around maintenance overload, rework, fragile automation, and integration burden. AI can automate one task while creating new responsibility for review, repair, compliance, support, and coordination. In that sense, AI adoption does not clear the desk by default. It can redesign the overload, turning today’s automated shortcut into tomorrow’s institutional friction.
6. From Signals to Organizational Design
Pressure, manifesting as the built-in friction and capacity strain of how work is architected, operates as a leading contributor to capacity loss and individual strain tracked in organizational health metrics. Our results point to a simple conclusion: work pressure is not only something organizations detect after people struggle. It is something organizations design, move, absorb, and sometimes return through the ordinary structures of work across sectors. The public signals we mapped made this movement easier to see, showing where pressure has surfaced, where work is slowing down, where repair has been postponed, where support demand is rising, and where governance has become part of the workload itself.
Pressure Moves Through Design
Pressure does not simply disappear when organizations respond to it. It often moves. A new approval step may reduce risk in one place while increasing waiting, documentation, and rework somewhere else. A new reporting layer may improve visibility for leadership while adding coordination burden to teams already carrying delayed execution or maintenance overload. A new compliance check may prevent errors while also creating another point where work has to stop, justify itself, and wait.
This is where the red tape field and the repair backlog connect. Governance friction can manage pressure in one place while returning it as work somewhere else. Maintenance burden can do the same when deferred repair becomes repeated workaround, recurring incident, or daily friction. From one angle, the pressure may look controlled. From another, it has become additional work for someone else to carry.
When Support Becomes Endurance
The human consequences sit inside work architecture. Exhaustion, loss of motivation, detachment, and personal coping are not separate from the operational signals described in this article. They can be understood as possible human trade-offs of working inside environments shaped by accumulated coordination weight, where necessary approvals, deferred repairs, and structural handoffs become a daily operational tax. The person absorbs the pressure that remains unresolved and partly hidden in the work architecture.
When measures intended to relieve work pressure arrive only after pressure has surfaced, they are already responding to consequences rather than causes. Once pressure appears as absence, turnover, delayed delivery, quality problems, or support demand, the organization is already seeing downstream signals. At that point, the priority is no longer another generalized response, but a tailored mapping of the inner work architecture. Such mapping allows organizations to address the harder design questions: what is producing those signals in the first place? Where did the work accumulate? Which repair was postponed? Which approval protected the work, and which one slowed it down? Which workaround kept the day moving while creating tomorrow’s workload?
Useful responses do not come from a generic checklist of fixes, nor does every pressure signal require a large redesign. Sometimes the first useful intervention is smaller and more specific: removing a duplicated approval, clarifying ownership of a recurring workaround, turning repeated support demand into a repair priority, or making AI-related review work visible before it becomes hidden coordination load. The point is not to add another program around pressure, but to identify where the work architecture is returning pressure and change that part of the design. Importantly, these interventions become actionable only when the pressure pattern is mapped inside the specific work architecture that is carrying it.
This logic is especially important for AI adoption. Automation may remove one task while creating new work around review, repair, compliance, support, and coordination. An AI tool that looks efficient at the task level may still add pressure at the system level if ownership, oversight, maintenance, and escalation remain untracked. The issue is not whether organizations should use new tools. The issue is whether they can track the new work and pressure those tools create around them. The form of this AI-driven pressure will differ by organizational size:
›Small or scaling startups may first see pressure as speed: fast automation, improvised ownership, fragile integrations, and technical debt that stays invisible until the team has to maintain what it built.
›Medium-sized organizations may see the same pattern as uneven adoption, role ambiguity, training burden, and coordination work between teams that are no longer small enough to rely on informal alignment.
›Large organizations may see pressure concentrate in governance: vendor review, model oversight, compliance, security approval, and accountability structures.
The same shortcut can therefore create different forms of workload depending on the architecture it enters.
A Diagnostic Framework for Work Architecture
Public evidence cannot answer every internal causal question. It is strongest where pressure has already become visible. That boundary is useful: it shows where organizations can begin looking, and it helps shift the conversation from work pressure as a private resilience problem toward work pressure as a design problem.
Diagnostic questions for your organization’s work architecture:
□ Which structures are protecting the work, and which are returning pressure to the people doing it?
□ Which fixes are reducing burden, and which are turning into new coordination, maintenance, or review work?
□ Which teams are carrying pressure created somewhere else?
Answering these questions requires looking beyond individual coping strategies and personal development programs, and toward the work architecture itself. If organizations want to sustainably reduce work pressure, they need to see not only the people who are struggling, but the environments that keep returning pressure to them.